Beta
This website is in development — content and design are still changing
Tool
CEDS – Community Earth atmospheric Data System CEDS
The Community Emissions Data System (CEDS) uses existing emissions inventories, emissions factors, and activity/driver data to estimate annual country, sector, and fuel specific emissions over time. First a default emission estimate is developed using IEA energy statistics and emissions factors, mostly derived from GAINS (combustion), EDGAR (non-combustion) and CDIAC (for
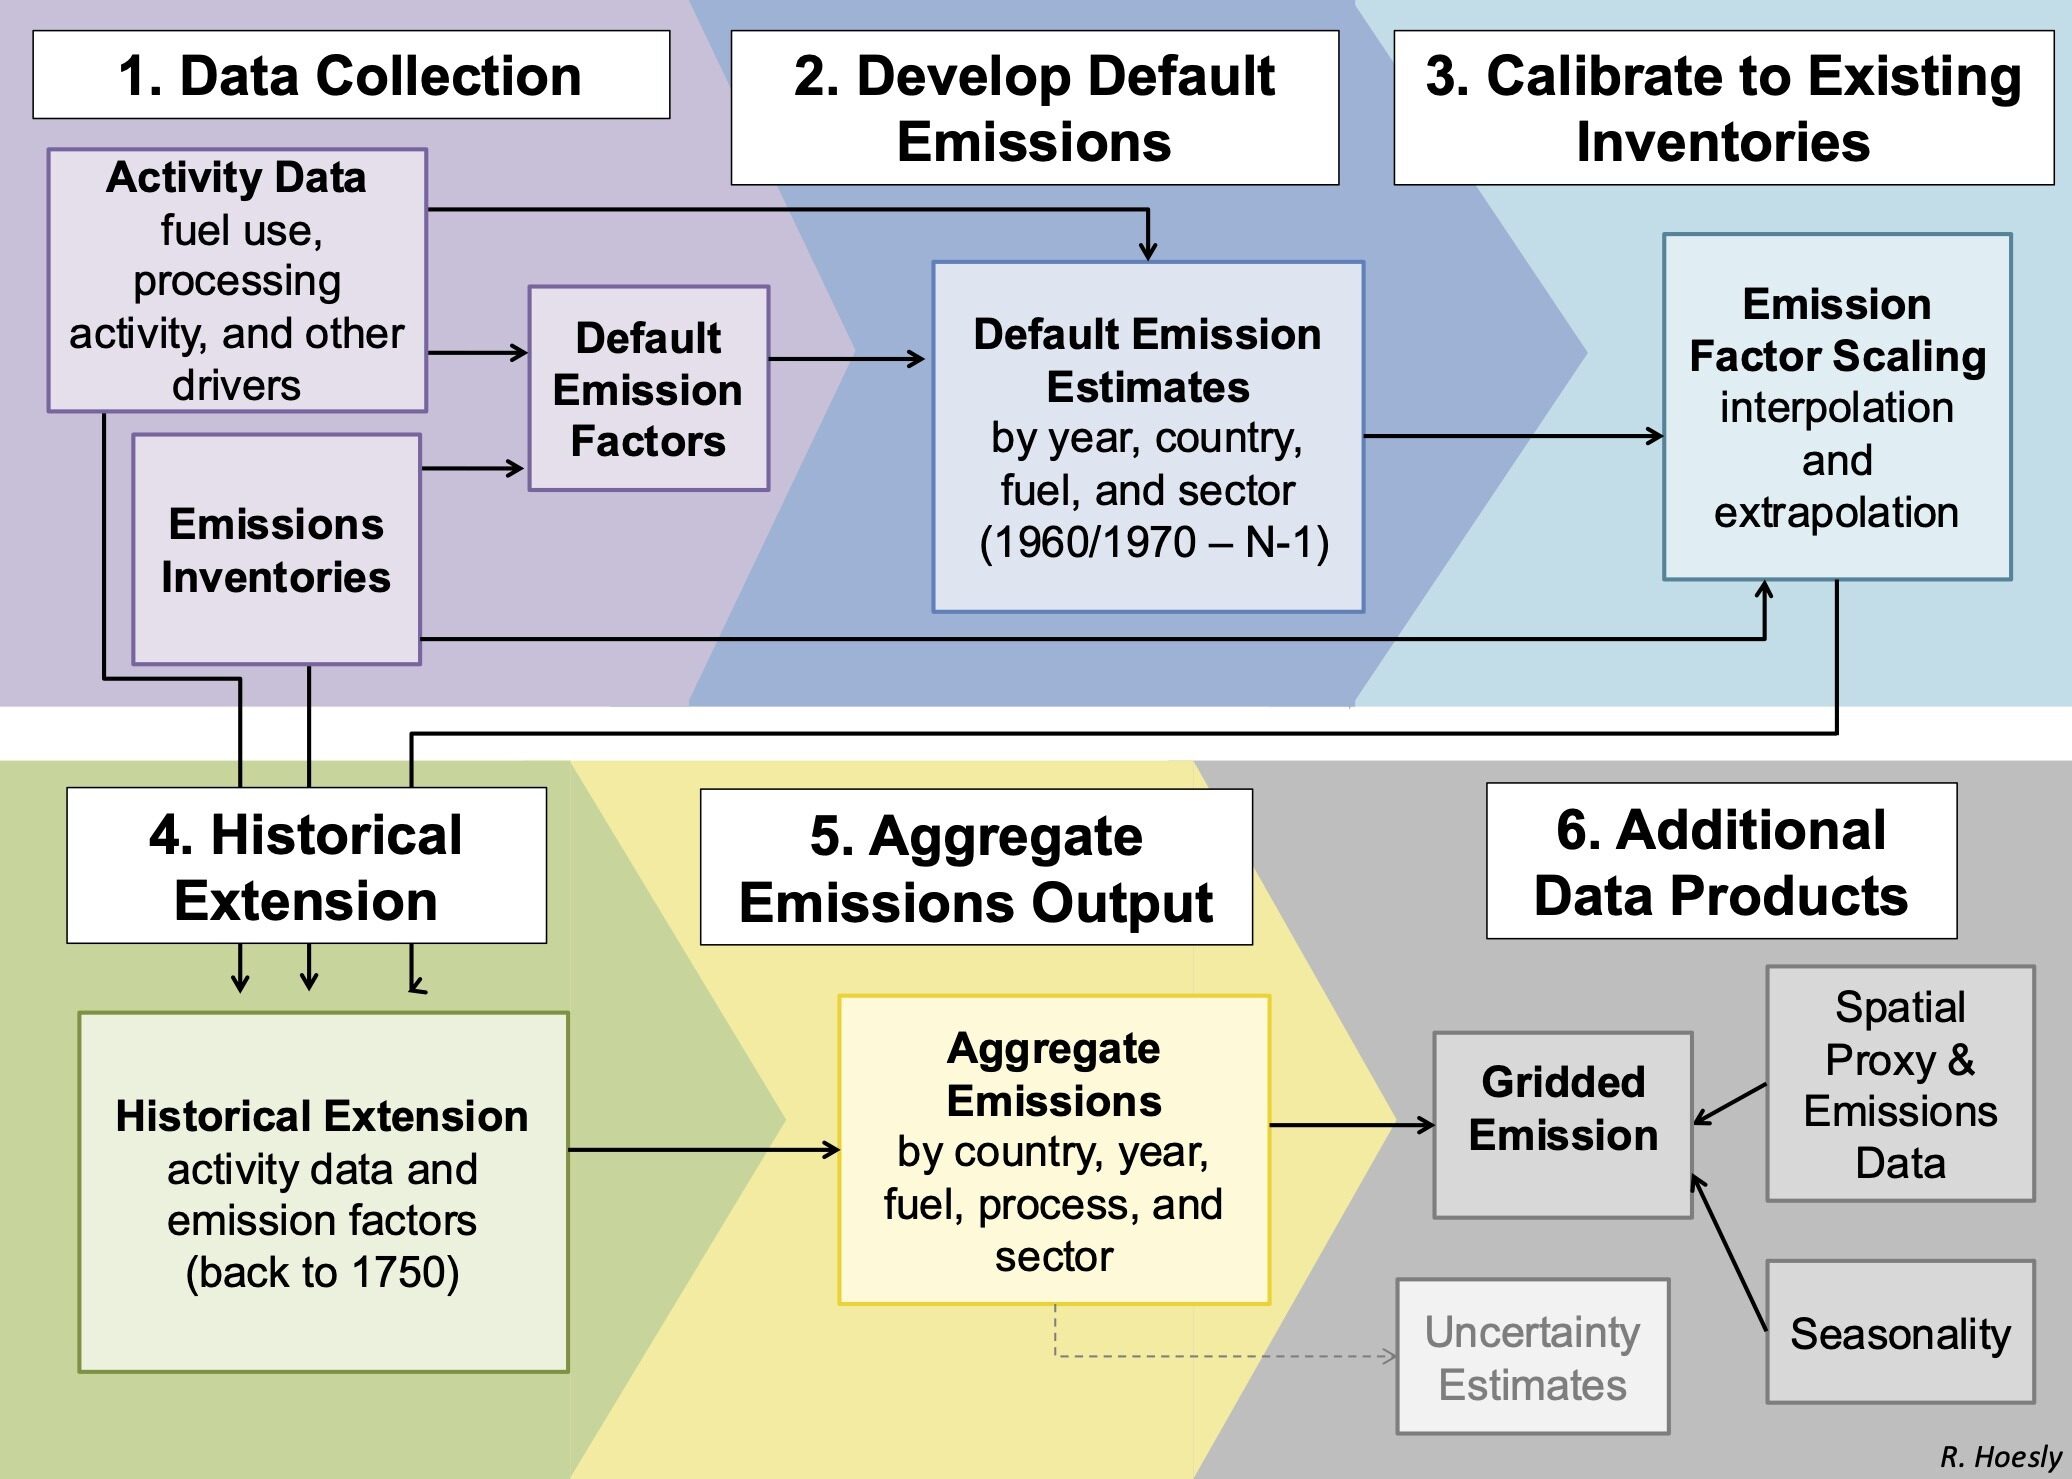
The Community Emissions Data System (CEDS) uses existing emissions inventories, emissions factors, and activity/driver data to estimate annual country, sector, and fuel specific emissions over time. First a default emission estimate is developed using IEA energy statistics and emissions factors, mostly derived from GAINS (combustion), EDGAR (non-combustion) and CDIAC (for CO2 emissions). Default estimates are scaled to match existing national and regional emissions inventories where available, complete, and plausible including (but not limited to) national reporting to EMEP, MEIC, US EPA trends, and REAS. Scaled emissions estimates are extended back to 1750 by extending activity data and emission factors separately to produce a full trend from 1750 to the latest full years. Finally, gridded emissions with monthly seasonality and VOC speciation are produced from aggregate estimates at the country level using spatial proxy data (largely EDGAR gridded emissions) and distributed by 9 final gridded sectors. Detailed methodology, data, and assumptions are available in the main text and supplement of the accompanying journal article published in Geoscientific Model Development (Hoesly et al., 2018). The system is written using the open source R language and all input code and data are public except the IEA energy statistics used for the modern period.
The CEDS project regularly releases updated aggregate emissions data (sector, country/sector, country/fuel and country/sector/fuel), gridded emissions at 0.5° for all years, and downscaled to 0.1° for recent decades (from 1980), along with the underlying code and data. The system was also extended to include N2O. For further details see the project GitHub site, https://github.com/JGCRI/CEDS, which includes links to the aggregate emission data and figures comparing the new data with past releases. To receive announcements of data updates and releases please sign up for the project listtserv. For comments, feedback, or contributions to improve these emission estimates, please contact ssmith@pnnl.gov or rachel.hoesly@pnnl.gov.
Circular ReBoundary is a free online learning resource that helps businesses and organisations adopt circular economy practices effectively. Developed by CMCC (Euro-Mediterranean Centre on Climate Change) in close partnership with T6 Ecosystem and other research partners of the CircEUlar project, this tool addresses a common challenge: ensuring that well-intentioned sustainability efforts and
As part of the CircEUlar project, Centro Euro-Mediterraneo sui Cambiamenti Climatici (CMCC) is proud to announce the launch of Circular ReBoundary, a new online resource showcasing circular practices, testimonials, survey findings, and insights on rebound effects. More information is available here. In addition, you can discover Circular ReBoundary in action! Join
A team of European Climate and Energy Modelling Forum researchers has unveiled a new method to decode intricate energy and climate models. In a recent publication in Nature Energy, they introduce “model fingerprints,” a visual tool simplifying the comprehension of complex models’ key features. Energy models are crucial to understand